Continuing on the Data warehouse article series, this is the next article, Data Warehousing Best Practices for SQL Server at www.mssqltips.com. I have updated the list of articles as well at Data is everywhere, but?: All Data Warehouse Related Articles.
Saturday, January 6, 2024
Saturday, December 9, 2023
All Data Warehouse Related Articles
Writing is my passion. Writing has opened me many avenues over the years. Thought of combining all the data warehouse related article into a one post in different areas in data warehousing.
DESIGN
What
is a Data Warehouse? (mssqltips.com)
Things
you
should avoid when designing a Data Warehouse (sqlshack.com)
Infrastructure
Planning for a SQL Server Data Warehouse (mssqltips.com)
Why
Surrogate Keys are Needed for a SQL Server Data Warehouse (mssqltips.com)
Create
an Extended Date Dimension for a SQL Server Data Warehouse (mssqltips.com)
SQL
Server Temporal Tables Overview (mssqltips.com)
Data Warehousing Best Practices for SQL Server (mssqltips.com)
• Testing
Type 2 Slowly Changing Dimensions in a Data Warehouse (sqlshack.com)
• Implementing
Slowly Changing Dimensions (SCDs) in Data Warehouses (sqlshack.com)
• Incremental
Data
Extraction for ETL using Database Snapshots (sqlshack.com)
• Use
Replication to improve the ETL process in SQL Server (sqlshack.com)
• Using
the SSIS Script Component as a Data Source (sqlshack.com)
• Fuzzy
Lookup Transformations in SSIS (sqlshack.com)
• SSIS
Conditional Split overview (sqlshack.com)
• Loading
Historical Data into a SQL Server Data Warehouse (mssqltips.com)
• Retry
SSIS Control Flow Tasks (mssqltips.com)
• SSIS
CDC Tasks for Incremental Data Loading (mssqltips.com)
• Multi-language
support for SSAS (sqlshack.com)
• Enhancing
Data Analytics with SSAS Dimension Hierarchies (sqlshack.com)
• Improve
readability with SSAS Perspectives (sqlshack.com)
• SSAS Database
Management (sqlshack.com)
• OLAP Cubes in SQL
Server (sqlshack.com)
• SSAS
Hardware Configuration Recommendations (mssqltips.com)
• Create
KPI in a SSAS Cube (mssqltips.com)
• Monitoring SSAS with Extended Events (mssqltips.com)
SSRS
• Exporting
SSRS reports to multiple worksheets in Excel (sqlshack.com)
• Enhancing
Customer Experiences with Subscriptions in SSRS (sqlshack.com)
• Alternate Row
Colors in SSRS (sqlshack.com)
• Migrate On-Premises SQL Server Business Intelligence Solution to Azure (mssqltips.com)
Other
• Dynamic
Data Masking in SQL Server (sqlshack.com)
• Data
Disaster Recovery with Log Shipping (sqlshack.com)
• Using
the SQL Server Service Broker for Asynchronous Processing (sqlshack.com)
• SQL
Server auditing with Server and Database audit specifications (sqlshack.com)
• Archiving
SQL Server data using Partitions - SQL Shack
• Script
to Create and Update Missing SQL Server Columnstore
Indexes (mssqltips.com)
• SQL
Server Clustered Index Behavior Explained via Execution Plans (mssqltips.com)
• SQL
Server Maintenance Plan Index Rebuild and Reorganize Tasks (mssqltips.com)
• SQL
Server Resource Governor Configuration with T-SQL and SSMS (mssqltips.com)
Friday, September 1, 2023
Dataset : T20 Outcome of Extra Delivery & Free Hit

Cricket is a fascinating game as it provides much entertainment for spectators worldwide. With the instruction of the T20 format, most countries except New Zealand and Zimbabwe other countries have franchise cricket. Franchise cricket has spanned the global mark of T20 cricket.
With cricket, there are common beliefs such as extra delivery that would be delivered once a bowler sends a wide or no ball, a free hit will have a very high impact, etc.
The following dataset is collected to verify these hypotheses. Data collection is not yet completed as well are you need to wait for results for a couple of months.
Wednesday, August 23, 2023
Violin Plot - Compare Data

Contrasting and comparing are part of data analysis to make vital decisions. A violin chart integrated with Box Plot is one of the charts that can be used to compare data. Let us see how we can utilize the Orange data mining tool to compare data using the Violin chart.
Let us assume that the following is the dataset that we need to compare.

In this dataset, there are five variables to compare. If you simply use a Violin chart without any preprocessing, you cannot compare charts in one chart. Therefore, there are a few preprocessing tasks to be done.

In the above preprocessing tasks, separate processing tasks are used for each variable. Select Columns, Edit Domain, and Feature Constructor are used. You can download the Orange workflow at ODM/Violine-Blog.ows at main · dineshasanka/ODM (github.com)
Finally, all data flows are connected and then used to Violin Plot, as shown below.

Now you can see from the above chart, it is easily can be compared. In the above example, X1 has higher values.
Monday, August 21, 2023
How Data Science Project Works - From the Koobiyo Teledrama
About five years ago, the Koobiyo teledrama was very popular due to the uncharacteristic nature of the teledrama. It was a political teledrama, one reason the teledrama became popular. However, this post is not to discuss the political side of the tele drama but to discuss the data science side of it.

Jehan, the main character of this teledrama, has the idea of building a tool to predict the future problems of people. He uses decision tree architecture to achieve this and explains his idea to his companion, Priyantha as shown in the below video. Watch from the 540th second.
So his idea is very clear. By using data like Gender, Marital Status, Professional Qualification, Parents' details, Friends' details, etc.
After building the predictive software, he presents his case to his good friend Hiruni and his developer too joins the discussion in the following video. Watch from the 40th second.
After observing the work done by Jehan, Hiruni was impressed, but she had a very vital question to ask. "Why do you think people will buy this". Jehan was a little perplexed by the question, and he stressed that this is the software that everyone will have at their fingertips. Obviously, people know their problems they need solutions, not to suffer from their own problems.
This is something important to us as data scientists. We are very good at technical details, but we need to understand the solution part of the tool. Remember, people need a solution to their problem not a technical tool.
Then Hiruni provide a solution to Jehan and asked him to provide this to a human resource person to predict the future problems of its own employees.
Then the solution can be viewed in the 21st second of the following video.
In the live demo, Jehan proves that it is important to select the best people for the organization from this software. It is clear how we should think from the business point of view rather than focusing on technical aspect mainly. As a data scientist, we need to look at the solution side of it.
Tuesday, August 15, 2023
Article : Learn about Data Warehousing for Analytical Needs
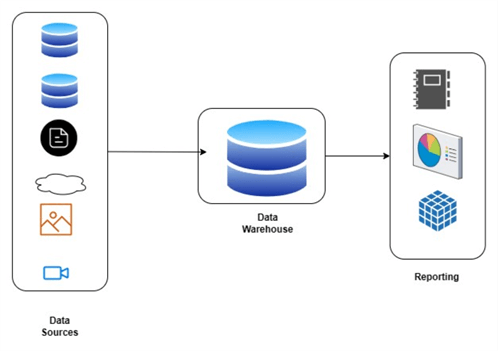
I started another article series at www.mssqltips.com on data warehousing. Even though there are many tools to build data warehouses, I still find there is a lack of conceptual knowledge in the community. So trying to cover that gap. So, read this What is a Data Warehouse? article and send your comments.
Sunday, July 30, 2023
Who is a Data Scientist? A Dragon a Pegasus or a Unicorn?

Unicorns, Pegasus, or dragons are mythical creatures that are created by combining the strong attributes of different animals. In Sri Lankan culture, we can see different dragons in temples. It is believed that these dragons are to protect various people and places.

These dragons have seven parts from different people, as expressed in the following poem.

As per the song, the dragon is a combination of
·
trunk of an elephant
·
legs of a lion
·
ears of a pig
·
teeth of a crocodile
·
eyes of a monkey
·
body of a fish
·
wings of a bird
The combination of these most strengthened parts will make the dragon a strong animal to achieve his required tasks.
Isn't that the same with a data scientist? Don't they need different strengths, as shown below?

Saturday, July 29, 2023
Clustering as Pre-Processing Technique for Classification
Clustering is often used to identify natural groups in a dataset. Since the clustering technique does not depend on any independent variable, the clustering technique is said to be unsupervised learning. The classification technique is supervised as it models data for a target or dependent variable. This post describes clustering as a pre-processing task for classification. This post has used the Orange Data Mining tool to demonstrate the above scenario.
Following is the complete orange data mining workflow, and this is available in the Git Hub as well.

The attrition sample dataset is used to demonstrate the above scenario. This dataset contains 18 variables with 1470 instances. Then the Jaccard distance is used, and it is essential to remember that you may have to choose a different distance technique in order to improve the results.

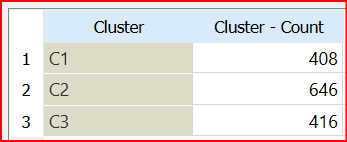
Then hierarchical clustering is used for three clusters as too many clustering will have smaller clusters and may cause overfitting. Following is the cluster distribution for the three clusters.
After the clustering is completed, the dataset is selected for each cluster and unnecessary columns (Clsuter and Selected) are removed. Then for each cluster, different classification techniques were executed. This scenario uses SVM, Logistic Regression, Neural Network, Random Forest, AdaBoost, Naive Bayes, Tree, and kNN classification techniques.
When classification techniques were executed for the entire dataset, without clustering, the best classification technique was Logistic Regression with a Classification accuracy of 87%.
Following are the classification accuracies and other evaluation parameters for each cluster once it is evaluated with all the above said eight different classification techniques.

The above table shows that C1 and C2 clusters have higher accuracy than the full dataset. However, the third cluster performance is not as good as the overall dataset classification.
This technique is better when there are large volumes of data if not clustering will reduce the data which can lead to model overfitting.
Wednesday, April 5, 2023
Is GPT-4 a Job Destroyer?

With rise of GPT-4, many jobs will be on the firing line. For example, with the expectation of 10% letter writing will be done with the use of GPT-4, job of secaratries are in danger. What about the software developers.You you can upload a image and get the source code from the GPT-4!!!
Wouldn't that be the same fear we had when the computers were introduced. Being in the Software field in early 1990s in Sri Lanka, I still remember how much pressure we had from many employees when we try to install new software applications. During most of the product demostration, we used to conclude our sessions by addressing that fear. We said that new software system will not destroy any jobs but instead it will create new jobs. Isn't that true? If I look back the those industries back, yes some jobs have gone for good, but there are new jobs.
Let us look at Cricket. During 1980's there were only a couple of camera for TV coverage. With the improvement in technology, now there are many cameras including spider, stump, drone etc. With these technologies, viewship has increased and more revenue avenues are being created. Further, cricket has become more glamoours and into a new world. With that new jobs are created and the good example is the third umpire.
Same will be inline for GPT. Let us wait and see in time to come.
Monday, December 12, 2022
2nd Evaluation of Oxford Mathematical Model during the Knockouts

Let us analysis the stage wise accuracy rates.

Would you accept this model with just over 50% of accuracy. That means it is just over the ad-hoc probability prediction. As we have been insisting, predicting the results outcome of a sport event, is not yet successful, it least for the moment.
Subscribe to:
Posts (Atom)